

Transportation of Natural Gas in Dense Phase – Nord Stream 1
Transportation of Natural Gas in Dense Phase – Nord Stream 1
Mahmood Moshfeghian, Ph.D.
Jay Rajani, Ph.D.
Kindra Snow-McGregor, P.E.
PROLOGUE
This paper was originally written before Russia invaded Ukraine. Given the current conflict, and the resulting energy crisis that has ensued in the EU, we want to clarify that the purpose of the tip of the month was to focus on dense phase transportation of natural gas. It should be noted that currently the Nord Stream 1 pipeline from Russia to Germany is currently not targeted by sanctions, and to date operations have been continuing normally [1]. It remains to be seen if the EU will decide to sanction natural gas from Russia, but it does appear that the EU is considering a ban on Russian LNG.
Companies that were active in Russian Oil and Gas assets such as Shell, BP and ExxonMobil, make the sustainability of Russian Oil and Gas imports questionable. The sustainability of Russia to be able to produce their assets with the support of many of their previous partners in the industry will remain to be seen. However, in the interim there is still the possibility of greater disruption if either Russia decides to shut off the gas flowing in Nord Stream 1, OR if the EU decides to close the valve, if you will, be depending upon the use of weapons in the Ukraine (biological, chemical, or nuclear). For now, Spring is coming to the EU which should provide some relief in terms of natural gas demand. But it should be recognized that 47% of the natural gas imports to the EU in the first quarter of 2021 came from Russia [2]. Replacing the quantity of gas that was provided from Nord Stream 1, in the long term, may prove a challenge. Securing long term LNG supply contracts and developing the LNG import infrastructure to replace the volume of gas flowing from Russia will take time. This will require major investments in LNG import facilities, with reliable LNG sources that the EU can trust.
Introduction
When a pure compound, in gaseous or liquid state, is compressed above the critical temperature and pressure, it becomes a dense, (highly compressed), fluid that demonstrates properties of both liquid and gas. For a pure compound above critical pressure and critical temperature, the system is oftentimes referred to as a “dense fluid” or “super critical fluid” to distinguish it from normal vapor and liquid phases (see Figure 1 in the December 2009 Tip Of The Month (TOTM) [3] for carbon dioxide and in January 2010 TOTM [4] for a typical natural gas). The Dense phase is a fourth (Solid, Liquid, Gas) (dense) phase that cannot be described by the senses. The word “fluid” refers to anything that will flow and applies equally well to gas and liquid. Pure compounds in the dense phase or supercritical fluid state normally have better dissolving ability than do the same substances in the liquid state. The dense phase has a viscosity similar to that of a gas, but a density closer to that of a liquid. As such, the dense phase is a favorable condition for transporting CO2 and natural gas, as well as CO2 injection into crude oil reservoirs for enhanced oil recovery (EOR).
Pipelines have been built to transport CO2 and natural gas [4] in the dense phase region due to its higher density, and this also provides the added benefit of no liquid formation in the pipeline for produced natural gas gathering systems.
In the January through April 2012 TOTMs we discussed several aspects of transportation of carbon dioxide (CO2) in the dense phase. We illustrated how thermophysical properties change in the dense phase and their impacts on pressure drop calculations. The pressure drop calculation utilizing the liquid phase and vapor phase equations were compared.
The application of dense phase in the oil and gas industry was discussed briefly in the August 2012 TOTM [5]. We have studied transportation of natural gas in the dense phase region and compared the results with the case of transporting the same gas using a two phase (gas-liquid) option. Our study highlighted some of the advantages as well disadvantages transporting natural gas in the dense phase.
In this TOTM, we will present an overview, including some of the unique features, of the dense phase transportation of natural gas by the Nord Stream 1 pipeline [6].
Case Study:
For illustration, we will consider the Nord Stream 1 (NS1) export gas pipeline [6]. The route of this pipeline is shown in Figure 1 and became operational in early November 2011. The NS1 is designed for transporting 2660.6 MMSCFD (75.34x10⁶ std m3/d) of a natural gas from Russia to Europe across the Baltic Sea. As it by-passes transit countries, NS1 provides Gazprom with direct access to European consumers via Germany. The pipeline ensures reliable flow of Russian gas supplies to Europe. Because the feed gas compositions were unavailable, let’s assume a lean natural gas with the compositions presented in Table 1. The corresponding mass flow rate is 1428 lbm/sec (647.7 kg/s). For simplicity, the calculations and subsequent discussion will be done on the dry basis. The 760.6 miles (1224 km) long pipeline with inside diameter of 45.4 inches (1 153 mm) have been considered. It should be noted, Nord Stream 1 is the longest sub-sea pipeline in the world.[6]
NS1 is a dense phase natural gas transportation pipeline that has no additional compressor stations along the line. Natural gas is compressed by the Portovaya compressor station, which has an aggregate capacity of ~490 000 HP (366 MW). This is an incredible about of power which is within the size range of many base-load power generation facilities. The compressor station feeds the gas into NS1 at 3190 psia (220 bara). The natural gas lands in Germany at 1537 psia (106 bara). There is a pressure control station on the German coast. There are no compressor stations in Greifswald. The pressure energy remaining in the pipeline is enough to transmit the gas 100 kilometers (60 mi) further onshore using no additional compressor stations [7].
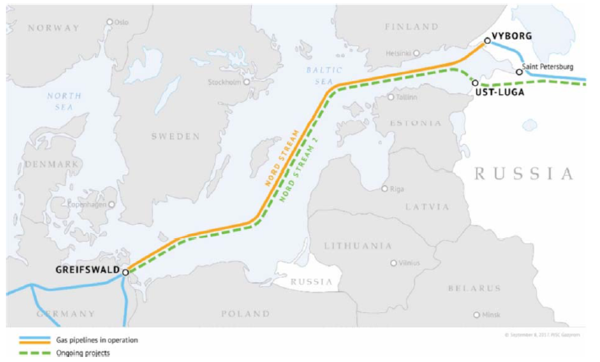
Figure 1 – The Nord Streams 1 and 2 dense phase natural gas pipelines, ©September 8, 2017,
PJSC Gazprom [7]
Table 1. Composition of the feed gas
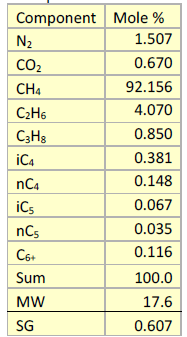
Note this is a lean gas stream. A lean gas stream more typical of transmission pipelines
would be: 93-97 % CH4, 1-2 % N2/CO2, balance C2+ (mole basis).
The inside diameter of the pipeline is kept constant at 45.4 inches (1153 mm) along the length of the route with an estimated error of only one millimeter. As the pipeline stretches farther away from the Russian coast, its outside diameter is decreased in parallel to the gas pressure decline. The pipeline is meant to sustain the working pressure of 3190 psia (220 bara) along the first 186.4 miles (300 km), and decrease to 2900 psia (200 bara) along the next almost 310.7 mile (500 km), and 2465 psia (170 bara) up to the end. The wall thickness in these three segments varies from 1.34 to 1.06 in (34 to 27 mm). By reducing the wall thickness of the pipe segments based upon the required design pressure in the line at that segment reduced pipeline capital cost without compromising mechanical integrity. The pipe segments are coated with a special anti-corrosion concrete coating. The concrete coating is made of high-density iron ore, which is crushed, mixed with cement, and applied to the exterior of the pipe segments. The pipe segments are wrapped with spiral reinforcements. The spiral reinforcements are filled with concrete, and then treated with steam in special tunnels for 24 hours [7]. The concrete coating helps meet several challenges at once: 1. it keeps the pipeline on the seabed, preventing it from drifting off with undercurrents, 2. Protects the pipeline from external corrosion 3. provides insulation, and 4. protects the trunkline from exterior mechanical damage See Figures 2 [7].
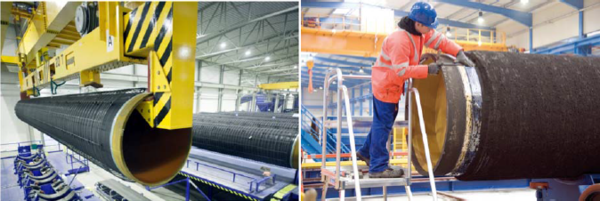
Figure 2 – Pipe fabrication for the Nord Stream Pipeline Gazprom [7]
The pipe segments used in the project are made of unique steel, in that it has high strength and elasticity. The roughness of the inside pipe surface is less than 6 microns (one micron is 0.001mm). To achieve this smoothness, the internal pipe surface is polished mechanically and then covered with a special polymer coating. The inlet conditions are 3190 psia (220 bar) and 42.8˚F (6˚C). The following assumptions and correlations are/used:
a. Dry basis.
b. C6+ considered as nC7.
c. Steady state
d. Minimum delivery pressure is 1537 psia (106 bara).
e. No pressure drops in separators.
f. Horizontal pipeline, no elevation change.
g. Inside surface absolute roughness is 6 micron (0.006 mm).
h. Multiphase flow correlation: Beggs and Brill. If the Volume Fraction of either phase
is below a tolerance of 1e-5, the flow is considered single phase, and the single-phase
regimes and calculations apply in the simulation.
i. Single Phase Friction Factor: Colebrook
j. Number of Length Increments: 10 (Increment length = segment length / number of
increments)
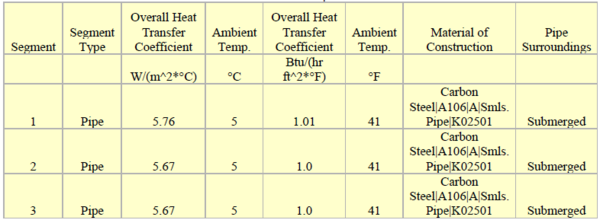
k. Overall Heat Transfer Coefficient: 1.03 Btu/hr-ft2-˚F (5.82 W/m2-˚C).
l. Simulation software: ProMax [8]
m. Equation of State: Peng-Robinson (PR).
Tables 2 and 3 present a summary of specifications for each segment of pipeline.
Table 2 – Pipeline specifications in SI and FPS units.
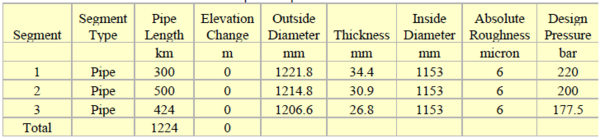

Table 3 - Heat transfer specifications in SI and FPS units
The process flow diagram (PFD) for this case study is shown in Figure 3. The pipeline outlet pressure must end up in the dense gas phase region. The pressure listing in bar for PIPE-A, PIPE-B, and PIPE-C indicate the maximum allowable working pressure for each segment.
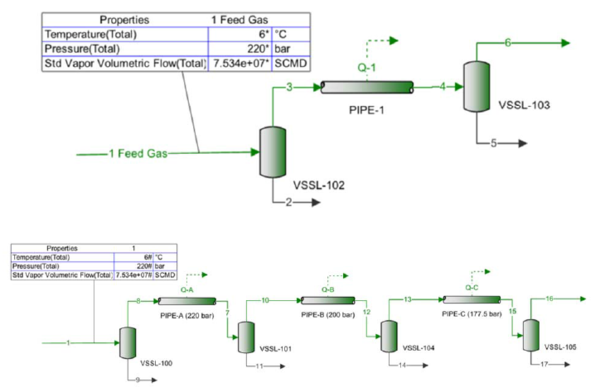
Figure 3 – The simplified process flow diagram (top PFD) and its expanded form (bottom PFD)
Simulation Results and Discussions:
The two PFDs shown in Figure 3 were simulated using ProMax [8] for the feed compositions shown in Table 1 and the design conditions. The summary of pipeline specifications is shown in Tables 2 and 3.
Figure 4 presents the summary of simulation results for the two PFDs. As expected, the results are the same for both PFDs. In the bottom PFD, more results are displayed. For example, one can see the inlet and outlet temperature, pressure, and standard volume flow rate of gas.
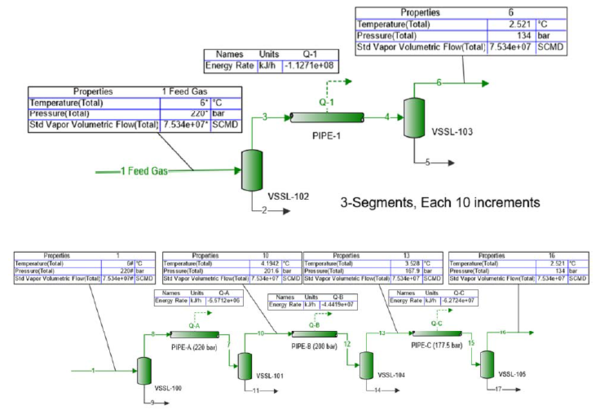
Figure 4 - The summary of simulation results for the two PFDs
Variation of temperature, pressure, cumulative pressure drops, gas density, viscosity, velocity along the whole length of pipeline is shown in Figures 5 through 8.
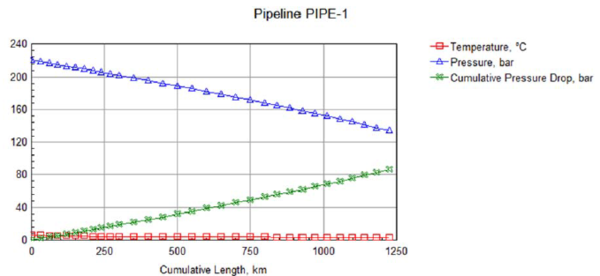
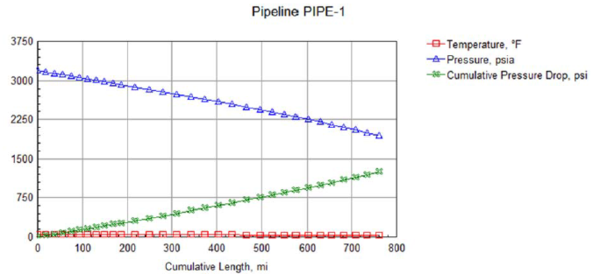
Figure 5 – Variation of temperature, pressure, and cumulative pressure drop along the whole length of pipeline.
Note that in Figure 6 the pressure varies from 3 190 psia to 1 943 psia (from 220 to134 bara) and the gas density varies from 13.7 lbm/ft3 to 9.0 lbm/ft3 (from 220 to 144.6 kg/m3).
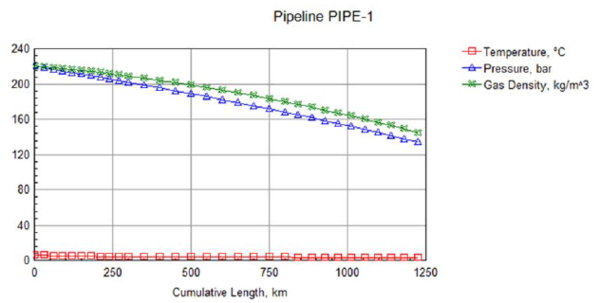
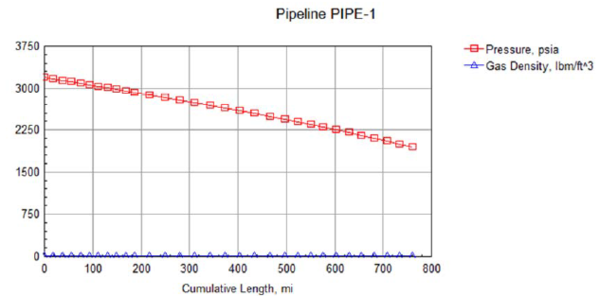
Figure 6 – Variation of temperature, pressure, and gas density along the whole length of pipeline.
Figure 7 indicates that as the line pressure declines, velocity increase from 9.25 ft/sec to 14.96 ft/s (2.82 to 4.29 m/s) due to the decline in gas density. Recall, the mass rate and the crosssectional area of the pipeline are constant. Thus, as the gas density decreases, the velocity in the pipeline increases. The gas viscosity varies from 0.025 to 0.017 cP, but the line temperature cools down from 42.8 °F (6 °C) to 36.5 °F (2.5 °C) due heat transfer between the pipeline and the subsea environment and includes the J-T expansion effect.
Figure 8 shows the pipeline pressure-temperature profile and feed gas phase envelope. The inlet condition: pressure of 3 190 psia (220 bara) and temperature of 42.8 °F (6 °C) while the outlet condition show: pressure of 1 943 psia (134 bara) and temperature of 36.5 °F (2.5 °C) are also indicated.
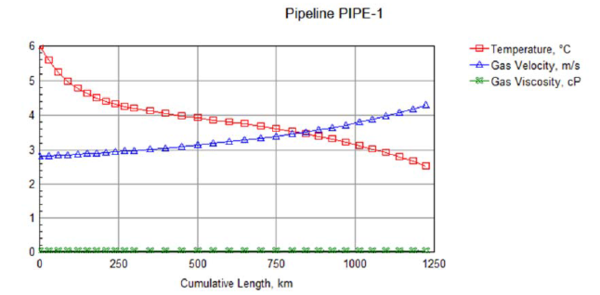
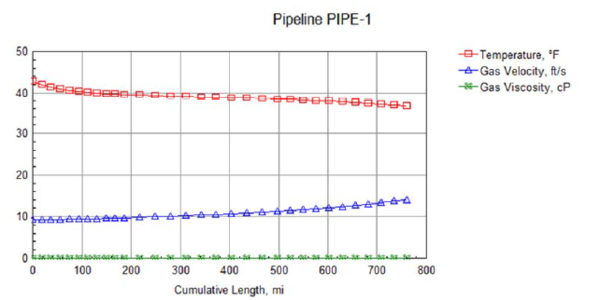
Figure 7 – Variation of temperature, gas velocity, and gas density along the whole length of pipeline.
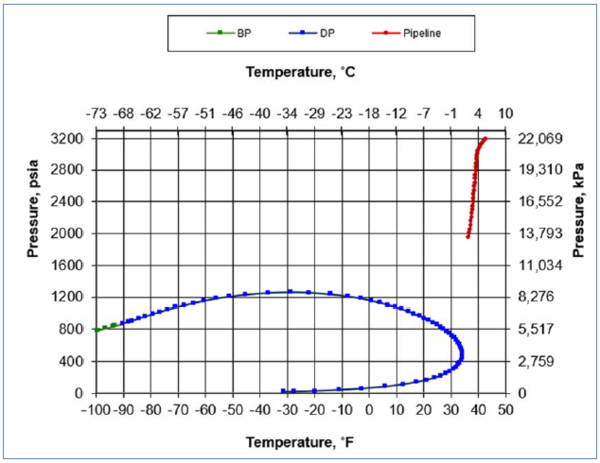
Figure 8 - Pipeline pressure-temperature profile and feed gas phase envelope.
Conclusions:
We have studied transportation of natural gas in the dense phase region that occurs in the Nord Stream 1 Pipeline. Our study highlights the following features:
1. Considerable compression power and cooling duty is required for the Nord Stream 1 Pipeline.
2. As with the previous tips of the month on this topic, dense phase transportation requires higher wall thickness (due to the very high pressures), but a smaller internal diameter is required (due to the high density of the gas).
3. Due to a special treatment, the roughness of the inside pipe surface is less than 6 microns which reduced the line pressure drop.
4. The use of smaller wall thickness for the lower-pressure sections, the pipeline CAPEX is reduced.
Other logical results can be stated as well including:
a. Composition of the gas plays an important role. Given the limited data on feed gas composition, the predictive tools show good representation of the long-distance gas flow pipelines.
b. Pipeline elevation profile and distance are important factors.
c. A detailed economic analysis in terms of CAPEX and OPEX should be made for a sound comparison for any new greenfield projects in natural gas pipeline transportation systems.
To learn more about similar cases and how to minimize operational problems, we suggest attending our G4 (Gas Conditioning and Processing), P81 (CO2 Surface Facilities), and PF4 (Oil Production and Processing Facilities) courses.
References:
1. https://www.reuters.com/business/energy/nord-stream-1-says-gas-supplies-europe-viapipeline- continue-2022-03-04/
2. https://www.rferl.org/a/russia-natural-gas-european-union-ukraine-nordstream/ 31723456.html
3. http://www.jmcampbell.com/tip-of-the-month/2010/01/variation-of-properties-in-the- densephase- region-part-2-%E2%80%93-natural-gas/
4. http://www.jmcampbell.com/tip-of-the-month/2010/01/variation-of-properties-in-the- densephase- region-part-2-%E2%80%93-natural-gas/
5. http://www.jmcampbell.com/tip-of-the-month/2012/08/transportation-of-natural-gas-indense-phase/
6. Beaubouef, B., “Nord stream completes the world’s longest subsea pipeline,” Offshore, P30, December 2011.
7. Gazprom; https://www.gazprom.com/projects/nord‐stream/
8. ProMax 5.0, Bryan Research and Engineering, Inc., Bryan, Texas, 2022.
Appendix A
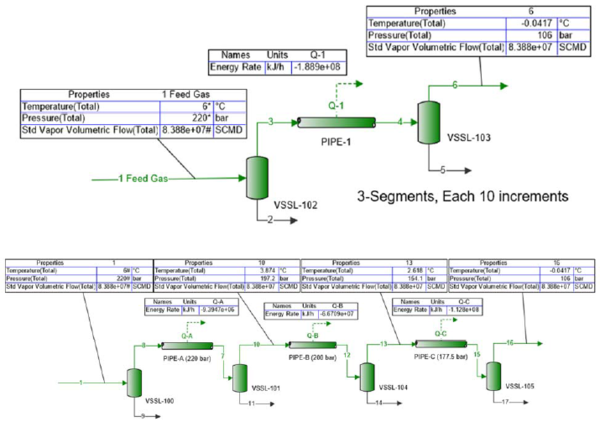
Figure 4A - The summary of simulation results for the case of maximum gas rate to meet
minimum delivery pressure of 106 bar (Ambient temperature of 5 °C)