


The Realities of Big Wind and Solar and the Need for Responsibly Produced Hydrocarbons – Part 1 Why Energy Density Matters
The Realities of Big Wind and Solar and the Need for Responsibly Produced Hydrocarbons – Part 1 Why Energy Density Matters
By: Kindra Snow-McGregor, P.E.
Introduction
The U.S. recently passed the Inflation Reduction Act (IRA) of 2022 which “doubles down” on environmental justice and renewable energy [1]. The newly created Clean Electricity Investment Tax Credit (CEITC) is available for any investment in qualified electric generators and storage facilities that are placed in service after December 31, 2024, that have a life cycle greenhouse gas emissions rate of zero or less. Renewables, wind and solar generators, do not have a net-zero greenhouse gas emission level if one considers their cradle to grave life cycle; from the sourcing of the raw materials to transportation to the site, construction and maintenance activities required.
The North American Electric Reliability Corporation (NERC) reported in their 2022 State of Reliability Report, that “Electricity and natural gas interdependencies are no longer emerging risks but require immediate attention, including implementation of mitigating approaches”. Natural-gas-fired generators are now necessary balancing resources for reliable integration of the growing fleet of variable (intermittent) renewable energy resources and can be expected to remain so until new storage technologies are fully developed and deployed at scale to provide balancing. Given the trend on electrifying the gas gathering, processing and transmission facilities, reliable electric power supply is critical to ensure uninterrupted delivery of natural gas to these back-up generators. This is particularly important in areas where renewable generation resources have high penetration rates [2].
The current technology for baseload battery storage is currently cost prohibitive at the capacities required to maintain grid viability. The recent trend is to provide some nominal amount of battery backup (4 hours) for intermittent generation sources, but that is insufficient for extreme weather events or outages that last more than 4 hours. Thus, the need for fossil-fueled thermal power generation peak shavers for the foreseeable future until there is a step-change in battery technology, or we have another technically viable energy storage solution.
Consider the issues of renewable (wind and solar) generation, from a perspective of materials required, energy density and social and environmental footprints. This series of TOTMs will dig into the following topics on renewable power generation:
Part 1 - Why Energy Density Matters
Part 2 – What other Energy Dense Technologies May be Viable Alternatives?
Part 3 - Environmental Issues including rural land-use conflicts
Part 4 - Social Justice Issues of Renewables
Why Energy Density Matters
The materials required to produce a wind turbine are significant. Table 1 [3] provides data on the various types of turbines currently available on the market.
Table 1 [3]
Wind Turbine Data
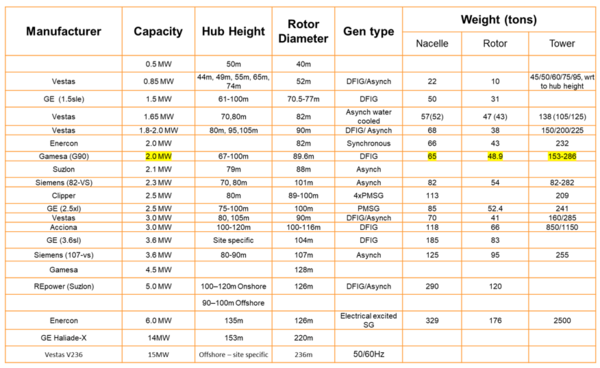
As can be seen from the table above, the amount of material goods required to produce and construct a wind turbine generator are massive and often overlooked. A full cradle to grave analysis and apples to apples comparison for different technologies is recommended under the greenhouse gas protocol (GHG Protocol), for large-scale grid generation facilities [12].
Figure 1 [4] from the International Energy Agency (IEA) provides a comparison of the amount of minerals that are used in renewable energy generation as compared to traditional dispatchable generation. The amount of minerals required for wind and solar are significantly greater than traditional dispatchable reliable technologies of coal fired, natural gas, and nuclear power generation. According to the EIA, it takes over 15,000 kg/MW of minerals for offshore wind turbines, roughly 10,000 kg/MW of minerals for onshore wind, and nearly 6,800 kg/MW for solar PV as compared to nuclear at ~5,300 kg/MW, coal ~2,500 kg/MW and lastly natural gas which requires ~1,200 kg/MW. Given the current energy crisis globally, inflation, supply chain and mining capacity constraints fueling inflation, we should be using our limited resources as efficiently as possible.
Wind turbine power generation has capacity factors of 38 – 55%. The capacity factors reflect the “net” average generation capacity of the turbine or turbine power plant. For example, the nameplate of a wind installation is misleading. A 1000 MW wind installation in a HIGH rated location with a capacity factor of 50% could only be relied on to produce 500 MW over a period of time that encompasses a variety of weather regimes. Thus, twice the number of turbines would be required to meet nameplate capacity. For wind turbine power generation, wind speed and direction matter. Too high of a speed the turbines safety systems must “brake” the turbine in place to prevent over-speed. Too low of a wind speed and the turbine cannot spin fast enough to generate electricity. The power generation from a wind turbine is weather dependent. If the wind is not blowing, which recently happened in Texas during the last heat wave, the wind generators are not there to supply the much- needed energy for air-conditioning [5].
Solar PV generation capacities factors are lower than those of wind turbines. Locations that have high-capacity factors include (Phoenix) ~20.4%, medium (Kansas City) ~ 16.4% and low (New York City) ~ 15.3%. A solar PV plant does not generate electricity when the sun is not shining, and is highly weather dependent (cloud cover, snow, hail, dust, etc..). In addition, solar panel capacity declines roughly 0.5% per year [13]. As a result, solar is intermittent baseload generation with misleading nameplate capacities. A 1000 MW solar installation in Phoenix, with a capacity factor of 20.4% could only be relied on to produce 204 MW of power continually over an extended period of time depending upon local weather conditions.
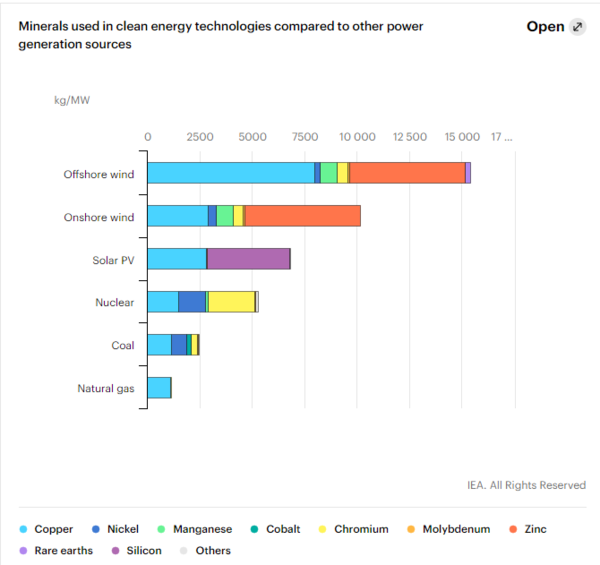
Figure 1. Minerals used in clean energy technologies compared to other power generation sources (Source: IEA [4])
Given the passage of the Inflation Reduction Act, investment and deployment of renewable generation capacity is poised to increase rapidly. Nations other than the U.S.A have also committed to achieving net-zero and have ambitions to increase wind and solar deployment. As a result, the increase in mining capacity to provide the metal and mineral demand for these clean energy technologies is set to increase rapidly, as shown in Figure 2 [6]. The Sustainable Development Scenario from the IEA report is their assumptions of what it would take to meet the Paris Agreement’s goals. Note by 2040 they are predicting that the world will need 6 TIMES more metals and minerals than what we were consuming in 2020.
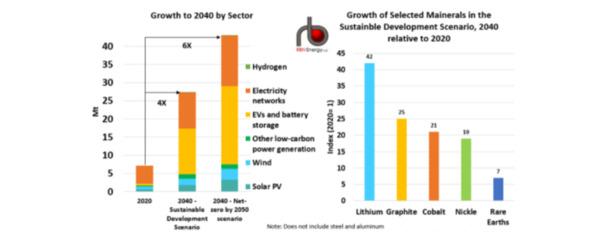
Figure 2 Metal and Mineral Demand for Clean Energy Technologies. Source: IEA [6]
The amount of lithium consumption required would increase 42 times from our current production levels. The amount of investment in mining and processing required to extract the metals and rare earths is enormous, and likely not feasible in the time frames required to meet their carbon emissions targets. This level of increased consumption will also result in economic impacts in other markets, such as computers, manufacturing equipment, housing, consumer products, etc... The higher demand will inflate the prices across the board for all products that require the use of these metals and minerals in their production. The other issue not addressed is the environmental damage in the locations where the new mines will be located, and the associated energy consumption and resulting CO2 emissions required for extraction (diesel trucks) and processing (often in locations where coal fired electrical generation is dominant).
Over the past two years, the global production of wind turbines, solar panels, and electric vehicles has increased significantly. The growth in the demand for many key minerals and metals has already surpassed the current supply constraints. The price of lithium mid-March 2022 was averaging $76,700 a tonne, the price last year was $13,400 a tonne [7]. A five-fold increase. The commodity pricing for copper, nickel, cobalt and aluminum have seen significant increases as well [8], as shown in Figure 3.
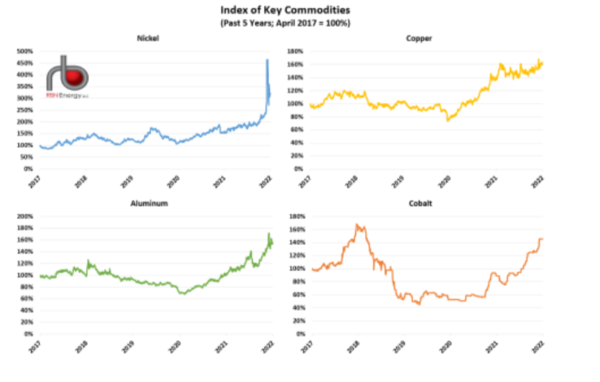
Figure 3. Index of Key Commodities (Past 5 Years; April 2017 = 100%). Source: Bloomberg [8]
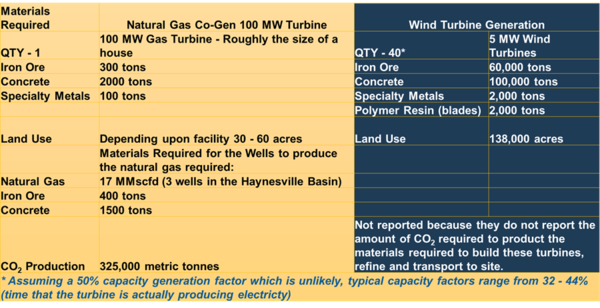
Considering the inflationary pressures and the limitations on current mining capacity, it makes sense to do an apples-to-apples comparison of a traditional thermal power generator to a wind turbine farm. Table 2 provides a comparison between a traditional gas-fired co-generation power plant with wind generation to put this into perspective. 100 MW power generation facility could provide power to roughly 75,000 homes [6]. Traditional natural gas co-gen power plants can produce power on demand provided they have reliable feed gas flow rates. The footprint and the amount of specialty metals and concrete use between the two options provides perspective in terms of what is energy “density”. This analysis should be an integral component of the viability assessment of each technology at a specific location and should consider the risks and costs associated with failure of the grid to provide reliable energy on demand (dispatchable) and include the total cost of investment for these modifications (transmission grid upgrades and expansion, peak-shaving generators, back-up energy storage, etc..).
Table 2 [6]
Comparison of Materials Required for Traditional Co-Gen Power Generation to Wind
We cannot replace energy dense sources of electric power generation with weak energy weather dependent sources without losing grid reliability, sustainability, and affordability. This has been demonstrated repeatedly in locations where heavy deployment in renewable wind and solar have been deployed, for example California, Texas, the UK and Germany. Note, this was a key finding from NERC that back-up power generation for times of low energy production from intermittent renewable generation was critical for grid stability. Energy density and dispatchability (perform on demand) is the foundation of which our modern industrialized societies were built upon.
As mentioned in the introduction, natural gas electric power generation is required to back-up intermittent power generation sources. Integration of these renewable resources increases the need for balancing to meet the forecasted load requirements of large grids. PJM is America’s largest regional transmission organization (RTO) that coordinates the movement of wholesale electricity in all or parts of 13 states and the District of Columbia. They provide power to 65 million people. They recently published the second phase of their ongoing study of the energy transition and the integration of renewable energy onto its grid. Figure 4 was taken from the PJM study presentation [9]. The figure shows the “duck” curve that they are anticipating by 2035. The production from wind and solar decrease in the afternoon and early evening, which is when demand increases in the winter as people arrive home, turn on their lights, cook dinner and adjust the heat in the home. PJM is expecting that a peak-demand winter day could require a 73-GW ramp up of resources that can respond to dispatch signals. Thermal generation can increase or decrease power output on demand (fossil-fueled or possibly nuclear but the flexibility of nuclear power generation to do so remains questionable). The ramp up power required is roughly equivalent to the amount of peak demand (75 GWs) that ERCOT currently experiences (grid operator for the majority of Texas. That is a significant amount of highly flexible responsive generation, which would likely be sitting idle most of the time. This is another example of why heavy deployment of renewables significantly increases power costs to the consumers, as was discussed in the October 2021 TOTM [10].
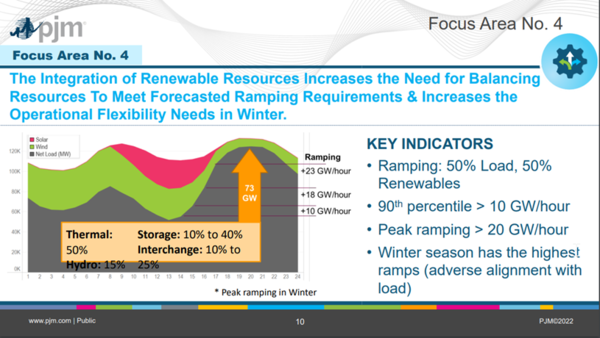
Figure 4. PJM Peak Winter Ramping [9]
Conclusion
Europe is in the throws of the worst energy crisis that many of us have seen in our lifetimes. Natural gas prices are now 10 times higher than they were on average and over 10 times as expensive than the U.S. Energy parity refers to when the cost of one energy source is equivalent to another. The cost of natural gas in Europe is currently equivalent to $500 barrel oil on a BTU basis [11]. Many industries in Germany and across the EU have shuttered or curtailed their production as they cannot afford the current energy prices. In many locations across Europe, coal-fired power plants are being started up in an attempt to keep the lights on due to the under-performance of wind and solar, underinvestment in oil and gas exploration, banning of fracking, and over-reliance on Russian gas from Nord Stream 1. They were also in the process of prematurely retiring their nuclear power generation. This is a regrettable example of why energy density, thermodynamics and energy reality should be included in government planning and energy security.
To learn more about the global natural gas economy, we suggest attending our G2 course (Overview of Gas Processing).
By: Kindra Snow-McGregor, P.E.
References:
1. King & Spalding Client Alert, “Inflation Reduction Act of 2022 Doubles Down on Social Justice”, Aug 16, 2022.
2. North American Electric Reliability Corporation, 2022 State of Reliability, July 2022.
3. Source: J. McCalley “Wind Technology”, https://slidetodoc.com/wind-technology-j-mc-calley-horizontal-vs-verticalaxis-2/
6. “Tell It Like It Is – Part 1 - Unseen Costs of the Energy Transition: Minerals, Metals and Construction Materials”, Mark Mills, Renewable Energy Analytics, Feb. 28, 2022.
7. https://www.mining.com/insane-lithium-price-rally-continues-with-little-relief-in-sight/
8. “Tell It Like It Is – Part 2 - Unseen Costs of the Energy Transition: Minerals, Metals and Construction Materials”, Mark Mills, Renewable Energy Analytics, April 8, 2022.
10. “Clean Energy Needs an “All of the above” Approach to Ensure Availability and Reliability”, Kindra McGregor, P.E., October, 2021.
11. https://foreignpolicy.com/2022/08/26/europe-energy-crisis-natural-gas-economy-winter/
12. Center for Strategic & International Studies report “The OECD and Carbon Life-Cycle Assessments” October 22, 2021 https://www.csis.org/analysis/oecd-and-carbon-life-cycle-assessments
13. NREL blog FAQ:Lifetime of PV panels
https://www.nrel.gov/state-local-tribal/blog/posts/stat-faqs-part2-lifetime-of-pv-panels.html